Wednesday, March 30, 2011

Waiting for your trade setup, increasing win ratio

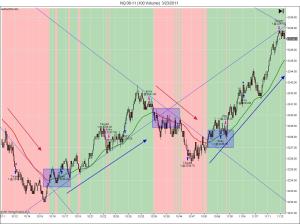
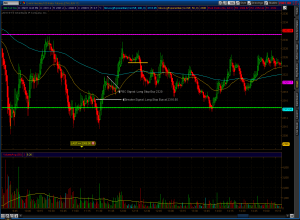
Today, 3/30/11, we had a longer term uptrend, but had a short-term downtrend in the morning signaled by a break out of long trend. However, we had no confirmation of this trend reversal for the longer term with a bigger picture cross. Due to this, we were waiting for the break out of short trend to take long positions. One of our areas that we look to enter positions is at our Points of Interest. Today, we had 2 long Points of Interest, blue rectangles, after the break out of short trend.

For the long trend confirmation, we were looking for a higher low to be set and then a continuation to the upside. The arrows, drawn prior to the actual movement, were what we were looking for to confirm the uptrend.

Tuesday, March 29, 2011

How to be on the right side of the market, determining trend / direction

We utilize our bigger picture charts for trend / direction determination. We only trade in the direction of our bigger picture charts, disregarding short signals, until we get an actual short direction confirmation. We establish our points of interest on our 5 min chart and consider every pullback in price a pullback, not a trend reversal right away. If this pullback is confirmed to be a trend reversal, we take trades in the direction of the new trend, until that direction is invalidated.

Recognizing entry / exit signals and managing positions

Here is our entry chart showing the end of the trading day today 3/29/11 and the entry signals given. On our bigger picture charts, as explained yesterday, we are only allowed to take long positions at the current moment.

The rectangles indicate the entry signal, the arrows indicate a lower high being set, giving us an exit signal for the trade. If this lower high is put in, we should exit the position at that time, which usually ends up being one tick or so above entry.

As you can see on the chart, our trade setup involves a pullback on our entry chart with a low being set and then a trigger line being broken to the upside for our entry / a break out of short term trend. We place our stop below the swing low that was set, usually 5-7 ticks, but never exceeding 16 ticks. 2)

The reason we wait for the trigger signal is because rather than just entering at an arbitrary price, we allow the heat to pass by, and then enter once buying pressure resumes.

Monday, March 28, 2011

Trend trading, entering positions, trading for a living, the HT way

We trade in the direction of the overall market, believing that a trader has better odds trading with the current sentiment in the market, rather than attempting to pick reversal points. When trading with the trend, the amount of heat taken during a position is much less than a counter trend trading philosophy. There are chop zones at the bottom and top of each trend, so the capitalization zone is the middle region of the trend. For example, in a 20 point move in the /NQ, there is approximately 4 points of chop at the bottom of the trend and 4 points of chop at the top of the trend; so the clean profit zone is approximately 12 points.

We first analyze the "bigger picture" charts, and establish the direction on these charts.

We then establish "points of interest".

For example, regarding today 3/28/11, we had a short signal around 9:35 am with a confirmation of the overall downtrend at 12 noon on our "big picture" chart.


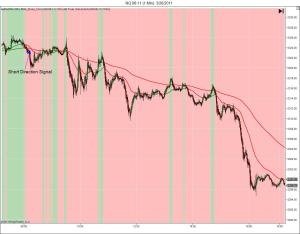
On our 1 min chart, we see that we got the short signal earlier, around 8 am. This direction held for the remainder of the trading day. Based on our system, a trader is only allowed to take short trades during these types of conditions.


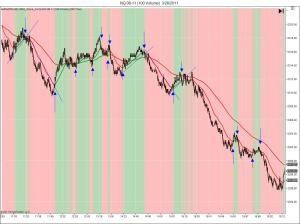
Next, we monitor the 100 volume entry signal chart for high probability opportunities. As you can see, this chart gives us both long and short signals. Our system makes us disregard / not enter the long signals because of the "bigger picture" conditions. We should only take the short signals.


Before we enter a position on our entry chart, we answer the following questions:

  • What is the 5 min 50/200 day cross direction and 200 day slope?

  • What is the 1 min 50/200 day cross direction?

  • Is the 1 min cross a “blip”, with a re-cross in the dominant direction / breakout of short-term trend highly probable, or is it a strong direction change accompanied by fundamentals, 5 min chart, and other charts?

  • Where / at what price are the donchian channel lines? Was the opposite channel line touched yet? If it was, consider a possible new trend formation is other charts indicate so with lower lows, lower highs, etc

  • Are you taking the signal on the 100 volume and 1 second charts that are in the bigger picture direction and disregarding the counter bigger picture signals?

  • Are you taking the signal at a “point of interest- 5 min, 1 min e.g.” or being impatient and entering on a weak signal?


If our answers agree with the potential trade, we initiate the position.

HT

Wednesday, March 23, 2011

Emini Futures (/NQ) Trade Entry Rules

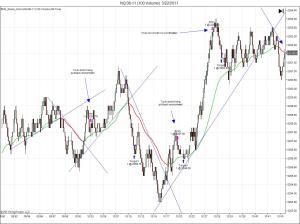
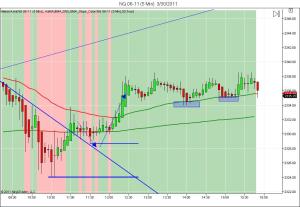
Here is a chart highlighting our trades today. We traded out of SIM most of the day since we are still validating a few things. Out of SIM we ended a positive $220, some of the trades are shown on the chart; we had 10 total.

One thing I want to explain is our entry rules:

We enter the signals that are triggered in the direction of the overall trend, disregarding initial / less significant counter trend signals (if the market has a strong trend supported fundamentally and technically for the day). Once we get a trend reversal confirmation, we consider trade signals in that direction and disregard the counter trend signals.

As you can see from the chart, we took both long and short signals that were given due to the fact that the market was not in a clear strong trend. There was little fundamental news pushing the markets except for housing sales numbers that came in worse than expected. Japan and Libya issues seem to currently be having a small impact on the markets at the moment. This may be due to the lack of volume from traders, who we believe are waiting for first quarter earnings to come out; which they will then begin moving money around once domestic figures start being released.

We draw trend lines on our chart, and look for a breakout of trend with confirmation from our other indicators to take a trade in the direction.

Tuesday, March 22, 2011

Trade Signal Confirmation / Direction Bias

Today was a tough day as mentioned in the earlier post. I want to show a chart of a few trades that were taken, and what we ended up concluding after analyzing the charts.


Here is a chart showing our entry prices and the targets that were hit. The first trade was taken short during an uptrend signal, making us take more heat than we normally like to; we eventually filled our target though since our full stop was not hit. The second trade was just pure luck. A short was taken at the top of a higher high (uptrend signal) and we got the target filled at the pullback point. The third trade was because of pure speculation of over extension, which is what we attempt to never do, so the fact that the trade worked out is lucky since we shorted with no short signal yet present. At the far right of the chart, we had a break of trend with potentially a lower high being form, which it did, and a short signal triggered on that pullup in price.

First quarter earning are on deck for traders, so the volume is extremely light in the markets currently; until some figures start coming out. Our primary issue today was lack of clear signals, lack of volume, and trading in an environment with weak signals. We ended the day with a small profit, hopefully we can apply our observations from today's tight market environment into the future.

3/22/11 Performance

9 Trades: $50 Profit – $34.38 Commission = Net Profit of $15.62.

Very low volume, undecided, choppy market today. It was quite difficult to apply the system efficiently in such a market with lack of movement. So, turning a profit (be it very small) in a tough day like today is taken positively overall.

I will post an analysis later tonight highlighting the conditions on a chart.

Monday, March 21, 2011

3/21/11 Performance

7 Trades: $70 Profit – $26.74 Commission = Net Profit of $43.26

We had a losing day on Friday so we stopped trading after we met our loss maximum of $120. For the rest of the day, we analyzed the mistakes, and made decisions on how not to repeat them.

Today was a good day in the sense that we followed our system properly. We actually had a 100% win ratio, with getting a few stops at 1 tick above entry.

I will post some rules / analysis later on tonight with accompanying charts to explain how I corrected the mistakes from Friday, and what we did today that was an improvement from the trades against our system on Friday.

HT
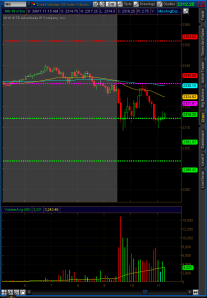

3/18/11 Performance

4 Trades: $120 Loss – $15.28 Commission = Net Loss of $135.28

We had a tough day today, taking a few trades against the system / our rules, so it shows what happens when you stray away from the rules of your trading system.

Our max loss that we allow for a day is $120, and we stop trading for the rest of the day. We then analyze the mistakes and correct them for the following day. The only good thing out of this day was that we stuck to our rule of halting trading for the day at our max loss of $120.

Thursday, March 17, 2011

3/17/11 Performance

8 Trades: $40 Profit – $30.56 Commission = Net Profit of $9.44

I will post charts and analysis later on tonight

3/17/11 Performance

8 Trades: $40 Profit – $30.56 Commission = Net Profit of $9.44

I will post charts and analysis later on tonight

Wednesday, March 16, 2011

3/16/11 Performance

15 Trades: $115 Profit – $57.30 Commission = Net Profit of $57.67

I will post charts and analysis later on tonight

3/16/11 Performance

15 Trades: $115 Profit – $57.30 Commission = Net Profit of $57.67

I will post charts and analysis later on tonight

Tuesday, March 15, 2011

HT System Rules: Listen to the Market- 2

Wanted to give you guys an update on the trade:

We met our target of 10 points, 40 ticks, on this position. We were trailing our stop throughout the course of this position. Here is the chart detailing the price action during the position, it also shows entry at 2257 and target at 2247, profit of 40 ticks.


Let me know if you have any questions.

HT

HT System Rules: Listen to the Market- 1

I want to share some rules that we apply to our trading on a daily basis:

  1. Don't tell the market what to do, you mean nothing to it

  2. Adjust yourself to changes in the market, the market will not adjust to you

  3. Follow what the market is doing, simple as that

  4. Consider any pullbacks in price as pullbacks, not reversals

  5. These pullbacks in price are considered opportunities

  6. Its up to you to intelligently apply the entry and money management rules in order to capitalize on the opportunities presented

  7. When a reversal occurs, you will know it (based on our rules)

  8. Be patient, wait for high quality setups

  9. Don't be greedy, nobody ever lost money taking profits


I wanted to show you a trade that I am in in which I adjusted to a change in market conditions. The recent trend in after-hours was up, we waited for our reversal confirmation prior to entering the short position. We never attempt to catch exact tops and exact bottoms, rather we wait for our A) pullback entry confirmation or B) trend reversal confirmation. We stick to money management rules and attempt to adjust to changes in the market quickly.

This chart shows the steady uptrend we were in, the trend reversal confirmation, and the short entry signal that we took. We will stay in the position until A) we meet target or B) the trade becomes invalidated, which we'll either force the fill or get stopped out.


We entered short at 2257 upon the short confirmation and have a 10 point target on this trade (We currently have an unrealized profit of 8 points). As mentioned above, we will either get the target filled or exit the position once the trade becomes invalidated.

HT

Daily Recap 3/15/11

8 Trades: $145 Profit - $30.56 Commission = Net Profit of $114.44

I will post charts and analysis later on tonight

Daily Recap 3/15/11

8 Trades: $145 Profit - $30.56 Commission = Net Profit of $114.44

I will post charts and analysis later on tonight

Money Management Rules (NQ)- 1

We enter trades based on our entry rules discussed in a previous post.

We begin with building a buffer for the day, taking 1 to 2.5 points on the NQ, attempting to accumulate $100. Then, we go from taking 1 to 2.5 points per trade to taking over 2.5 points. We move our stop from below/above swing points to 1 tick above entry. BUT we need to build up the profit on the day before we start trying to catch the bigger moves.

Money Management Rules for NQ:
- Max loss per day = $120
- Max loss per trade = 16 ticks, $80
- Never adjust stop against ourselves

Our stop management system allows us to usually reduce the risk of 16 ticks for the stop down to approximately 8 to 12 ticks per trade, but we NEVER take more than 4 points of risk per trade. If we amount to $120 in losses in a day, we stop trading for the rest of the day. We feel that psychologically a trader will make bad trading decisions and increase this loss even more, so the best decision is to stop trading, analyze the decisions made to amount to the losing day, and prepare/improve for tomorrow with the newly acquired information.

Happy Trading!

HT

Afternoon No Trade Zone

We have a rule of stopping trading before the afternoon chop. Here is a chart showing it pretty clear that we shouldn't be trading during the afternoon / current market environment. The breaks above and below the channel, with no conviction on the breaks for breaker positions, are due to institutional traders accumulating positions during this time. For example, buying 10,000 shares at 12:45, 10,000 shares at 1:00, etc etc. They accumulate their position over a period of time to say amount to 100,000 shares.

Friday, March 11, 2011

Taking Pullback Trades with Confirming Signals

Hi Everyone!

I would like to share some insight into our trade entry parameters. First, we determine trend. Second, we establish fundamental and technical reasons for the trend. Third, we establish the strength of the trend and level of noise in the market. Third, we look for trade setups with multiple confirming signals on various charts.

Later, I will share a losing trade that we took yesterday and reasons why we should have no been in it in the first place plus reasons why we managed it poorly and allowed for a full stop. I will also discuss how the trade should have been managed if you happened to take the signal given on one chart but no confirming signals from any other.

Trade Entry- Pullback trade- Lesson 1:

- We enter in direction of the trend.

- We wait for confirming signals, ignoring counter trend signals and single short-term chart signals. We wait for confirmations on multiple charts before entering the pullback trade.


As you can see, we had multiple buy signals on all three charts. Some of the signals occurred on one chart but not on the others, these entries would not be taken. Also, you notice that you get an initial signal on a chart, followed by another chart, and then confirmed with the final. These are the types of trades we are looking for. So, even though we had multiple signals, we are looking to enter into the higher probability positions to allow us not to take full stops.

We set our maximum initial stop at 16 ticks on the NQ. If we are about to enter the confirmed signal and have a stop at say 12 ticks, this is looked upon as great risk reduction. I will discuss our stop management in a different post.

Let me know if you have any questions!

HT

Thursday, March 10, 2011

3/10/11: Don't fight the trend...

until the reversal is confirmed.

We consider every pullup in price as an opportunity to enter short.

Break of 2283.50 would signal a potential trend reversal, long bias. But a break to the downside (after the 2283.50 break) of a critical level on our smaller charts will signal a continuation to the downside, with the break above 2283.50 being a false signal.

Wednesday, March 9, 2011

3/9/11 NQ: Trade Recaps- 3

Continuing from the previous post, "Breakers LONG above the 50 day on the 1 minute and above the swing point that was set may be a viable option if volume is present during the break." We had a breaker long signal as highlighted on the chart. A buy order placed at 2316.50, long trade was valid until 2324.75 was broken at 12:24pm.

If you missed the initial breaker entry, we had a PBC entry signal at around 11:54am, long at 2320, with the same invalidation point as the breaker trade.

3/9/11 NQ: Down-Trending Range- 2

Here is a chart of the 1 minute NQ for the day so far. As you can see, the bottom of the range was tested more heavily by price than the 1 top that was set at 10:30 am. Breakers LONG above the 50 day on the 1 minute and above the swing point that was set may be a viable option if volume is present during the break.


HT

3/9/11 NQ: Down-Trending Range

NQ is in a down-trending range with overall markets currently around lows for the day. DJ Transportation and DJ Utilities are the only two posting green tape right now. Oil has eased off, with the AMEX Oil Fund down -0.50% currently.


We finished trading for the day on the NQ. We had a late start, but ended up having 3 trades for $50.

Recap to come later tonight.

HT

Tuesday, March 8, 2011

HT Futures Trading Email Subscription

We just added the "Email Subscription" button at the right side of the blog for easy subscription. The best way to keep informed on our posts and receive trade opinion is to subscribe! So please spread the word!

Happy trading tomorrow,

HT

HT Futures Trading Email Subscription

We just added the "Email Subscription" button at the right side of the blog for easy subscription. The best way to keep informed on our posts and receive trade opinion is to subscribe! So please spread the word!

Happy trading tomorrow,

HT

3/8/11 NQ Chart

Hi Everyone,

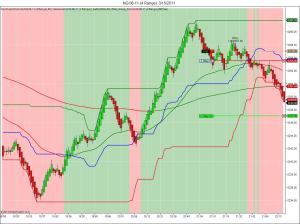
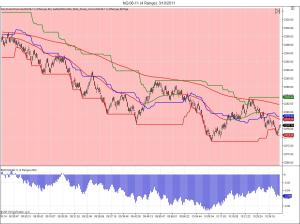
Here is a chart showing parts of our system / indicators on NQ futures. The chart mainly shows regular trading hours, but our system is applicable during after-hours and premarket as well; lack of volatility may invalidate trade signals during those times though, so caution is taken when considering signals after-hours. We utilize range charts, confirming trade entries with other time frames.


We have Balance of Power in the sub-graph to reduce noise.

Let me know if you have any questions.

HT

HT Futures Trading Introduction

Hi,

This page was created to educate traders on the HT Trading System, provide trading education as well as analysis on a daily basis, and to eventually offer a trading room online for interested traders!

We will be posting pre-market, regular trading session, and after hours posts. We hope to very shortly have a daily video recapping the trading day and to have videos of live trades that we enter to provide real-time education for you!

If you have any topics regarding the markets that you would like us to discuss, please feel free to let us know, we are here to help!

We look forward to networking with you!

Happy trading,

HT