Showing posts with label Market Commentary. Show all posts

Thursday, March 10, 2011

3/10/11: Don't fight the trend...

until the reversal is confirmed.

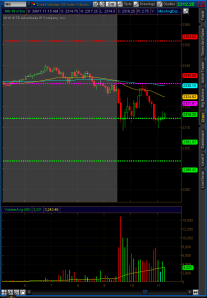
We consider every pullup in price as an opportunity to enter short.

Break of 2283.50 would signal a potential trend reversal, long bias. But a break to the downside (after the 2283.50 break) of a critical level on our smaller charts will signal a continuation to the downside, with the break above 2283.50 being a false signal.

Wednesday, March 9, 2011

3/9/11 NQ: Trade Recaps- 3

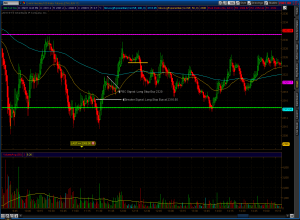
Continuing from the previous post, "Breakers LONG above the 50 day on the 1 minute and above the swing point that was set may be a viable option if volume is present during the break." We had a breaker long signal as highlighted on the chart. A buy order placed at 2316.50, long trade was valid until 2324.75 was broken at 12:24pm.

If you missed the initial breaker entry, we had a PBC entry signal at around 11:54am, long at 2320, with the same invalidation point as the breaker trade.

3/9/11 NQ: Down-Trending Range- 2

Here is a chart of the 1 minute NQ for the day so far. As you can see, the bottom of the range was tested more heavily by price than the 1 top that was set at 10:30 am. Breakers LONG above the 50 day on the 1 minute and above the swing point that was set may be a viable option if volume is present during the break.


HT

3/9/11 NQ: Down-Trending Range

NQ is in a down-trending range with overall markets currently around lows for the day. DJ Transportation and DJ Utilities are the only two posting green tape right now. Oil has eased off, with the AMEX Oil Fund down -0.50% currently.


We finished trading for the day on the NQ. We had a late start, but ended up having 3 trades for $50.

Recap to come later tonight.

HT

Tuesday, March 8, 2011

3/8/11 NQ Chart

Hi Everyone,

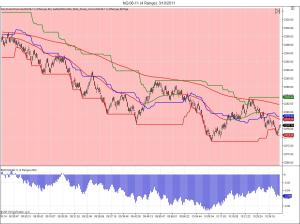
Here is a chart showing parts of our system / indicators on NQ futures. The chart mainly shows regular trading hours, but our system is applicable during after-hours and premarket as well; lack of volatility may invalidate trade signals during those times though, so caution is taken when considering signals after-hours. We utilize range charts, confirming trade entries with other time frames.


We have Balance of Power in the sub-graph to reduce noise.

Let me know if you have any questions.

HT