On April 24th, 2015 we made a judgement that it would be wise for stock market bulls to Tread Lightly. Since then, the S&P 500 has had two 10% + drawdowns, and is virtually unchanged. Most other equity markets fared much worse. Here we are again, but the setup is a bit different this time.
A Hyper-Bullish and a Terminal Trajectory for the S&P 500:

We think something like the latter case is in order. Here is why:
1) A relative chart of Consumer Staples versus Consumer Discretionary stocks appears to have bottomed, and is now uptrending. A little thinking would suggest this can't be bullish. This was not the case in 2013 (See Chart 2)
2) A relative chart of Stocks versus Bonds appears to have topped, and is now downtrending. A little thinking would suggest this can't be bullish. This was not the case in 2013 (See Chart 3)
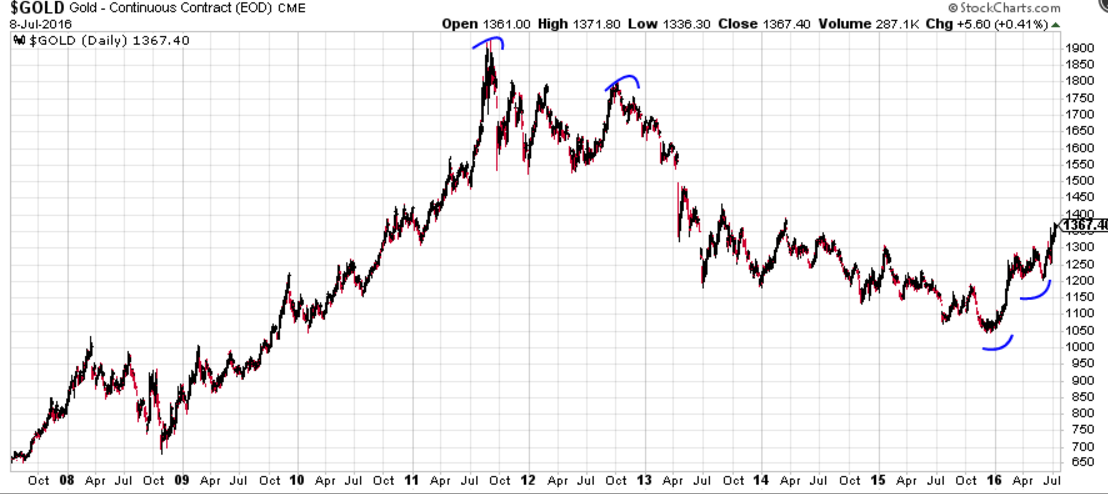
3) Gold appears to have bottomed, and is now uptrending. A little thinking would suggest this can't be bullish. This was not the case in 2013 (See Chart 4)
Staples Divided By Discretionary
Staples Divided By Discretionary

Stocks Divided By Bonds

Gold
Admittedly, the phrase used above "this can't be bullish", is a bit strong. Certainly, anything can happen. But that all three charts appear diametrically opposed to their 2013 setup should be alarming. Be safe.